Julian Straub
creations and thoughts
Arduino Voltage Logger

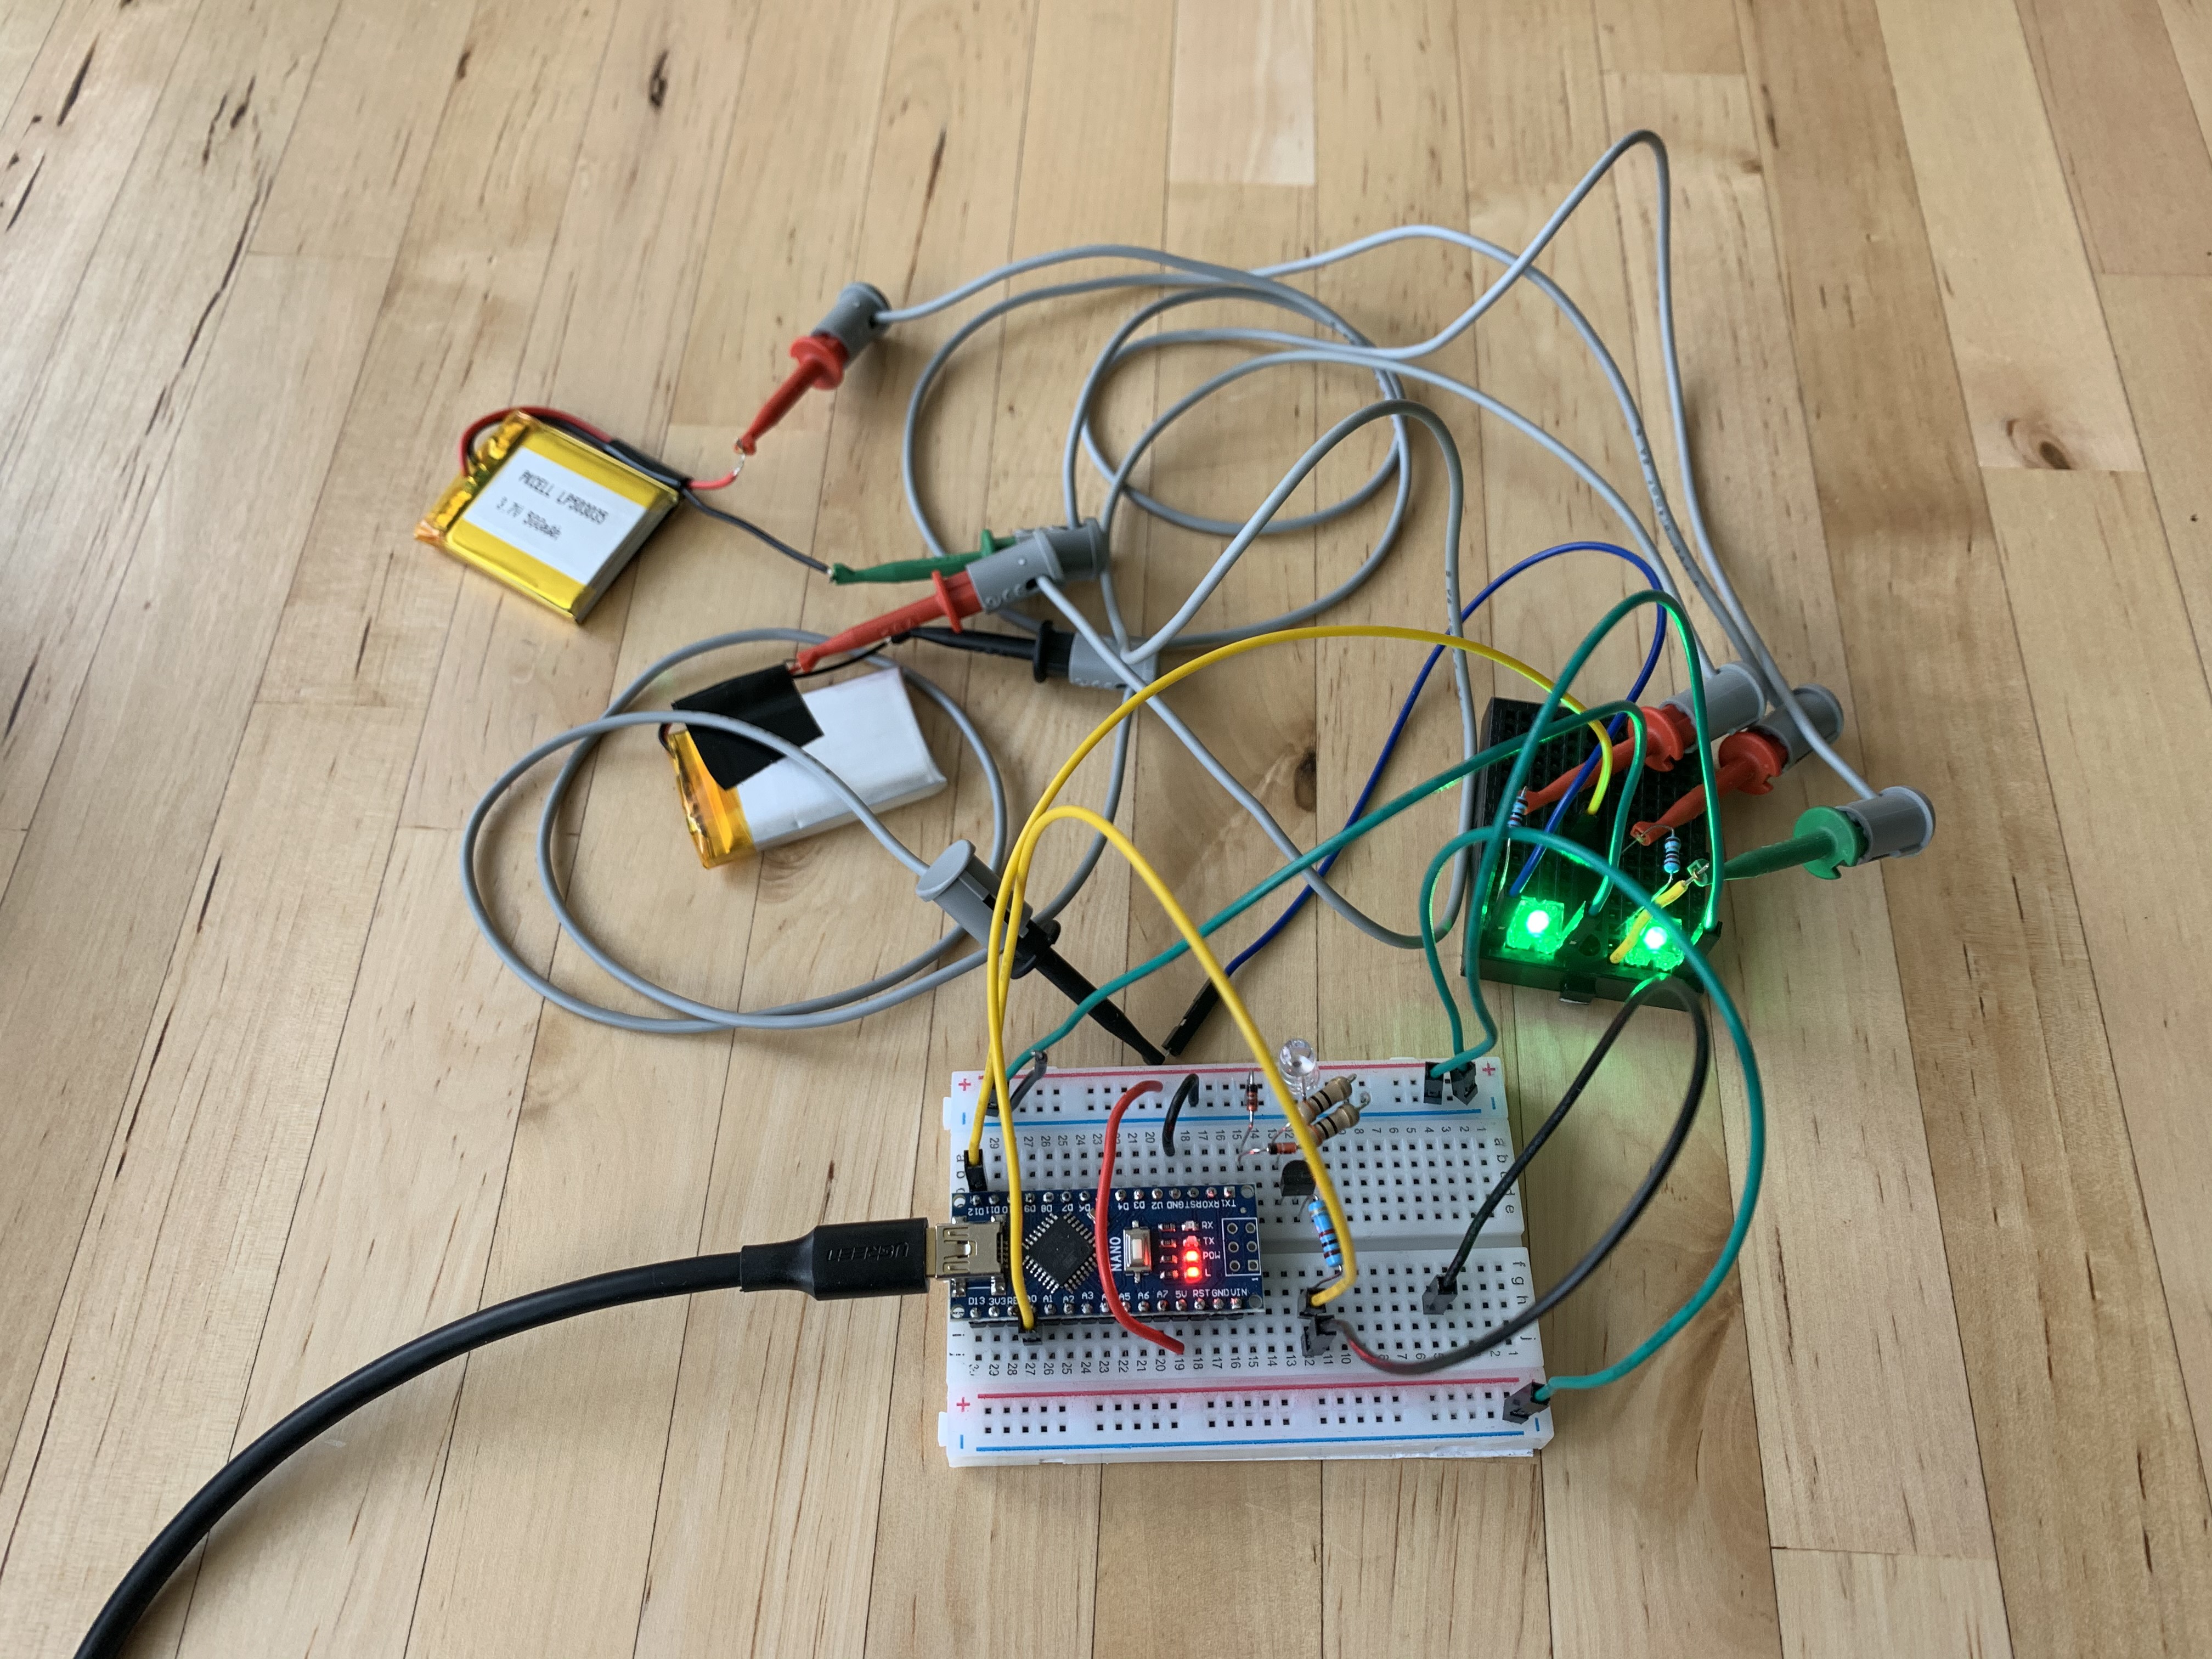
In order to log the discharge and charge curves of capacitors and batteries in the light harvesting devices, I programmed an Arduino Nano to be able to log the voltage on one of the ADC pins out through the serial port. Full code can be found on my github.
#include <avr/io.h>
#include <stdio.h>
#include <util/delay.h>
#include "adc.h"
#include "serial.h"

int main(void) {
  DDRB |= (1<<PB5);
  initAdc();
  // init serial connection to 115200 baud, 8bit, 1 stop bit.
  initSerial();
  char buf[100];
  uint16_t adc=0;
  while(42) {
    adc = readAdc0();
    float voltage = ((float)adc*5.f)/1024.f;
    sprintf(buf, "%d\t%f\n\r", adc, voltage);
    writeSerialStr(buf);
    // turn on proportional to adc
    uint16_t i=0;
    PORTB |= (1<<PB5);
    while(i++ < adc) {_delay_ms(1);}
    // turn off for the rest of 1024ms
    PORTB &= ~(1<<PB5);
    while(i++ < 1024) {_delay_ms(1);}
  }
}
The serial connection is established through the USB connection that is also used to program the Arduino. The output on the serial connection will is two numbers every 1024ms (see below for how to receive and log them on a linux computer). The first number is the raw 10bit ADC value and the second is the voltage that this corresponds to in volts.
...
826 4.033203
827 4.038086
826 4.033203
...
From the code you can also see that the onboard LED of the Arduino Nano will turn on for a time proportional to the measured voltage. This allows checking the functionality of the program without the serial connection hooked up.
One important gotcha is, that in order for avr-gcc to be able to properly
format float values using sprintf(), we need to
add the parameters -Wl,-u,vfprintf -lprintf_flt to the
compile command. The Makefile from the initial post on programming an Arduino in C needs the following update to the CFLAGS variable:
CFLAGS=-std=c99 -Wall -g -Os -Wl,-u,vfprintf -lprintf_flt -mmcu=${MCU} -DF_CPU=${F_CPU} -I.
I initially used Putty to visualize the serial data from the microcontroller:
putty /dev/ttyUSB0 -serial -sercfg 115200,8,n,1,NBefore I figured out that we can use bare bones linux terminal commands to do the same:
# setup the baud rate
stty -F /dev/ttyUSB0 115200
# output the received data to the terminal
cat /dev/ttyUSB0
This is also what log.h uses to write the logging results out to a file.
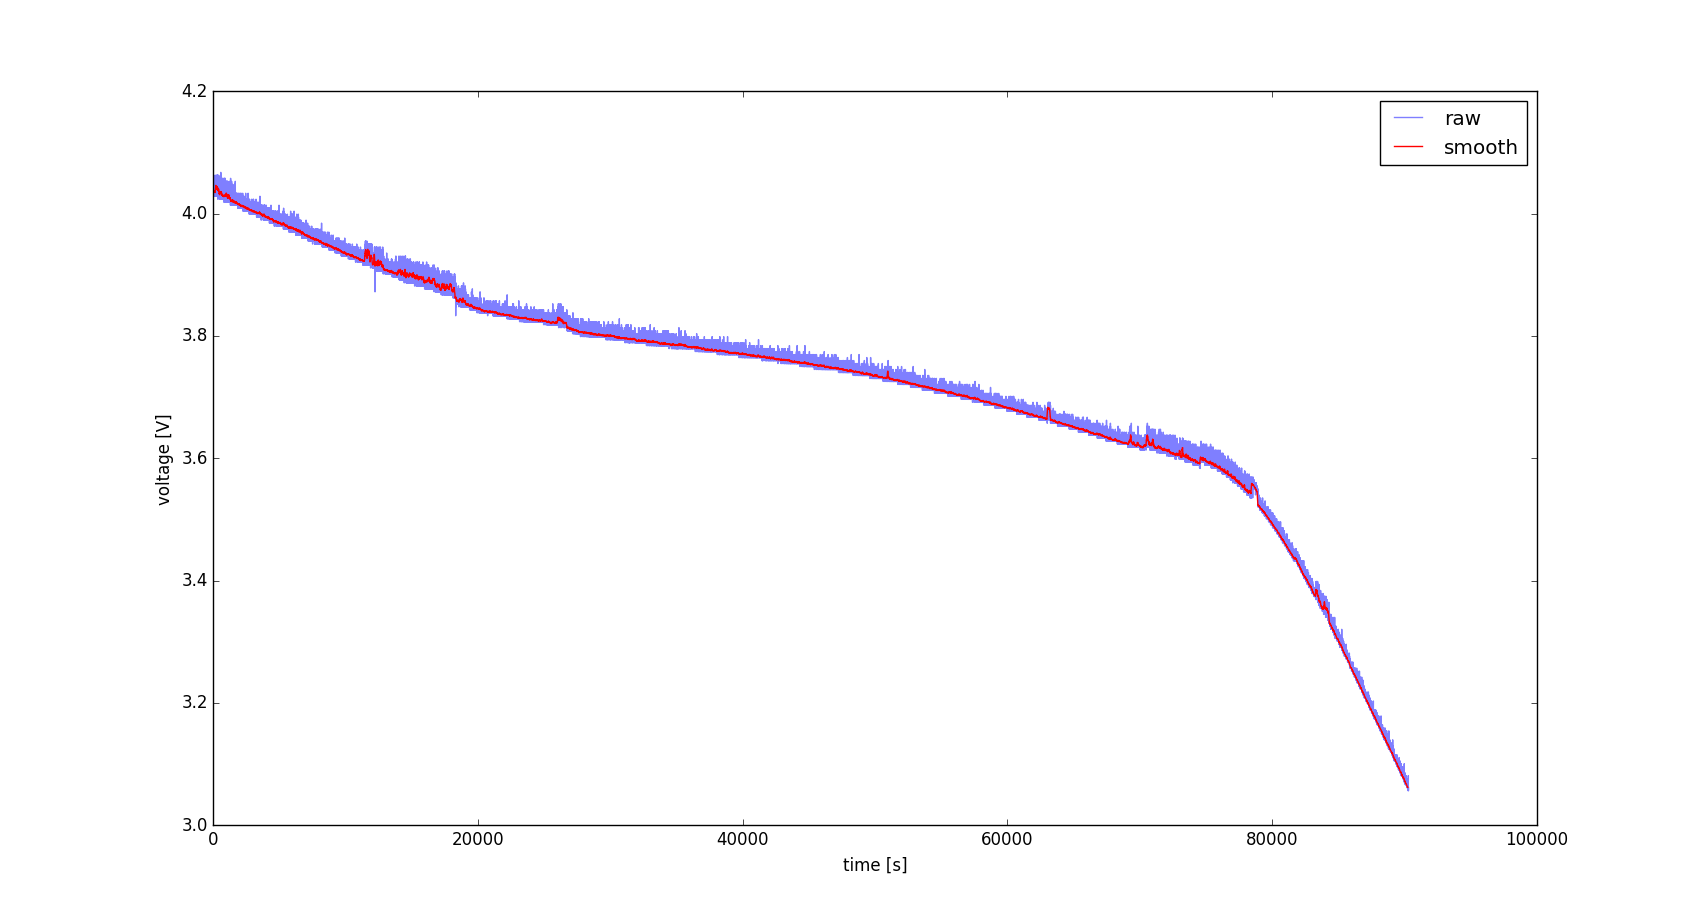
To plot the values you can use the plot.py script. Run it via
python plot.pyMake sure you have numpy and matplotlib installed and change the path in the first lines to the log you want to plot. Below see an example plot of discharging a Li-ion battery through a green LED.
